Quant · Graph ML · 2026
Forward Risk Manager
A walk-forward downside-risk pipeline that turns market data into graphs, trains Forward-Forward and backprop GNN variants, and reports model quality, speed, and trading economics side by side.
Problem
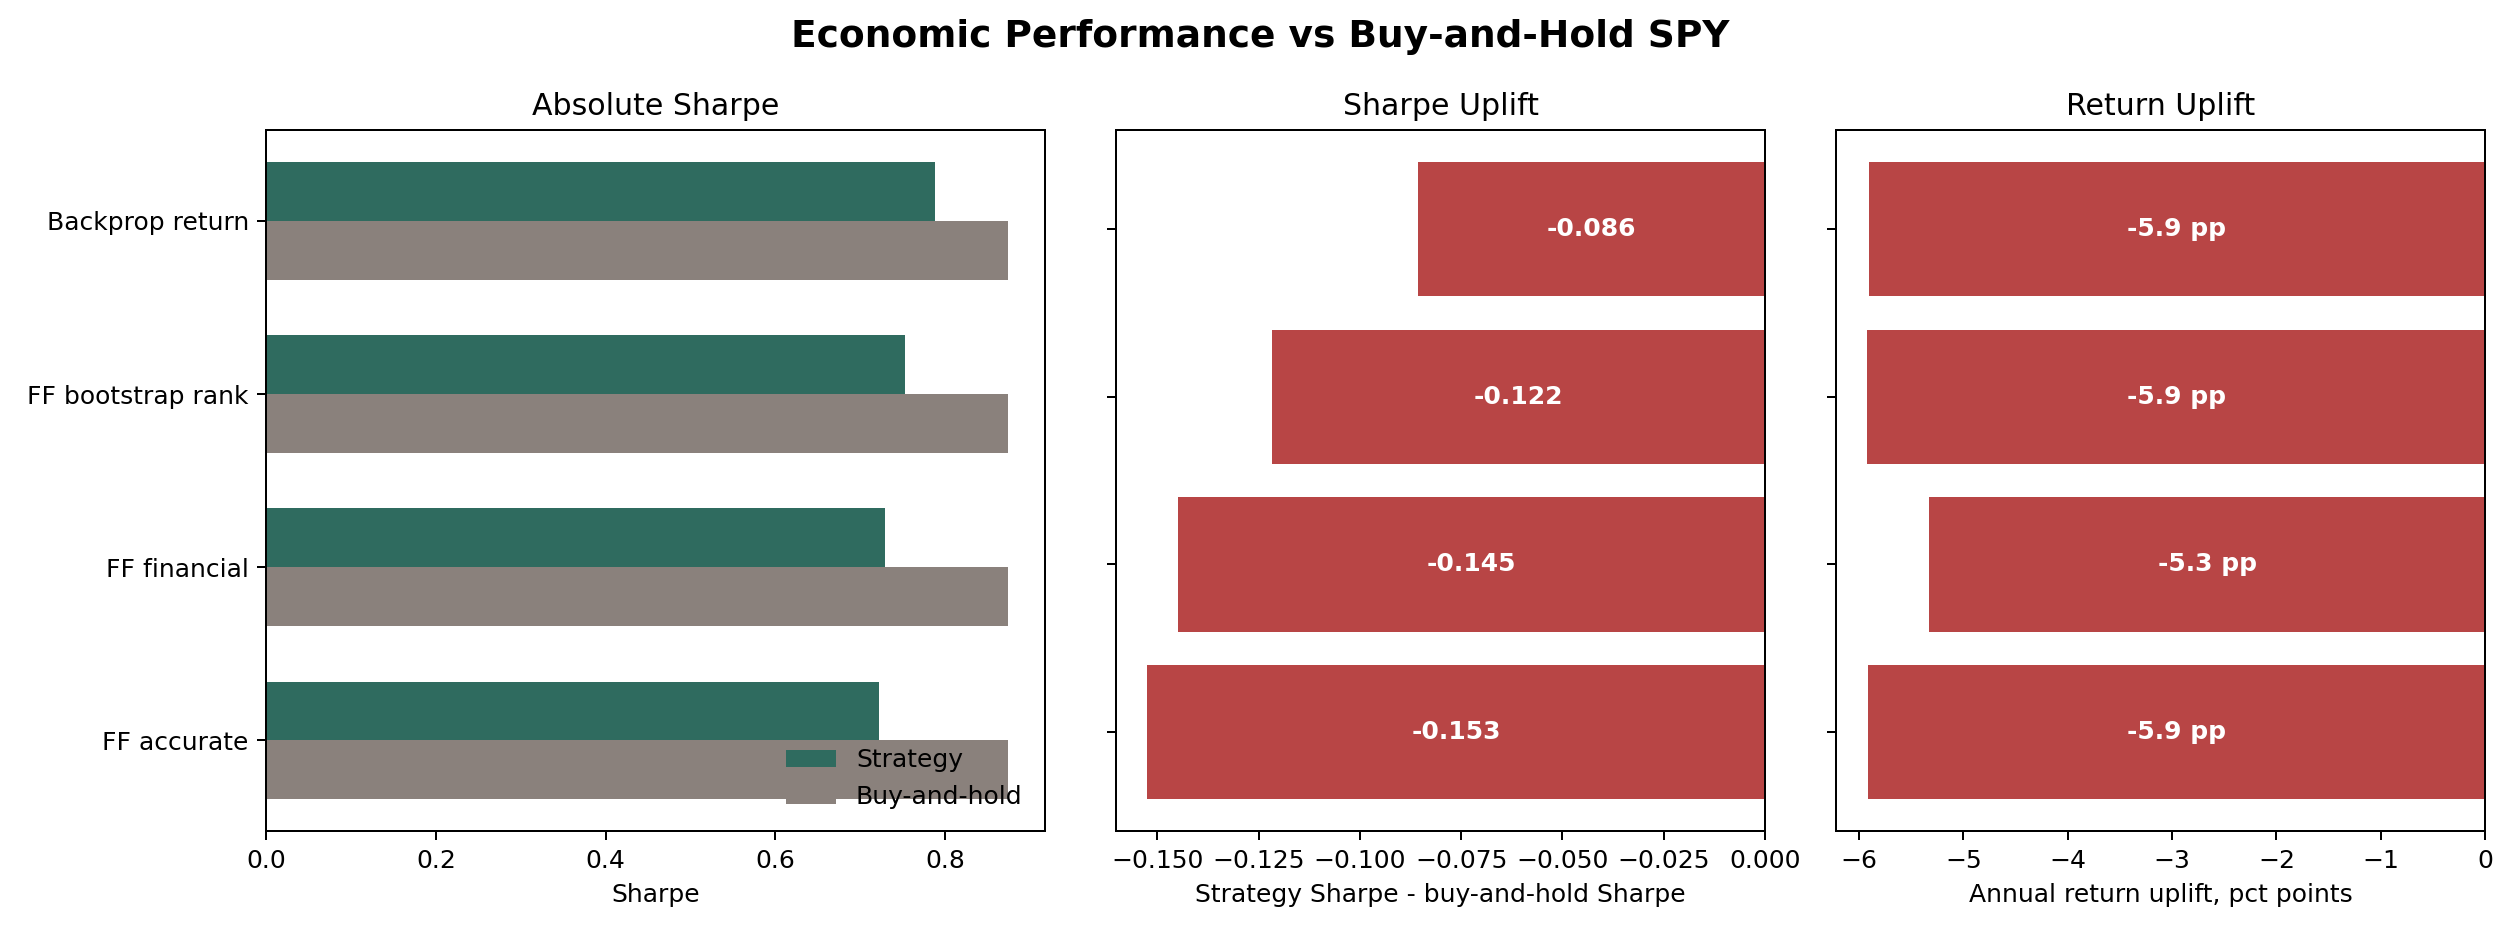
A risk model can look excellent on accuracy and still lose money. I wanted a single place where model quality, throughput, and the actual trading and risk numbers sit next to each other instead of in separate notebooks.
Approach
I built the whole path around one reusable codebase: graph construction, two flavors of GNN training (Forward-Forward and standard backprop), walk-forward benchmarks, scenario calibration, stress tests, parameter sweeps, and the report files at the end.
Outcome
The most useful part is where the numbers disagree. A model can score well statistically and still do badly on the economics, and the generated reports make that gap easy to see.